Risk perception and communication
April 14, 2011 — January 16, 2022
Suspiciously similar content
Risk, perception of. How humans make judgments under uncertainty, as actors able to form beliefs about the future. Some parts of this problem constitute a sub-field of science communication.
1 How good are we at reasoning under uncertainty?
Scott Alexander, A failure but not of prediction
And if the risk was 10%, shouldn’t that have been the headline? “TEN PERCENT CHANCE THAT THERE IS ABOUT TO BE A PANDEMIC THAT DEVASTATES THE GLOBAL ECONOMY, KILLS HUNDREDS OF THOUSANDS OF PEOPLE, AND PREVENTS YOU FROM LEAVING YOUR HOUSE FOR MONTHS”? Isn’t that a better headline than Coronavirus panic sells as alarmist information spreads on social media? But that’s the headline you could have written if your odds were ten percent!
So:
I think people acted like Goofus again.
People were presented with a new idea: a global pandemic might arise and change everything. They waited for proof. The proof didn’t arise, at least at first. I remember hearing people say things like “there’s no reason for panic, there are currently only ten cases in the US”. This should sound like “there’s no reason to panic, the asteroid heading for Earth is still several weeks away”. The only way I can make sense of it is through a mindset where you are not allowed to entertain an idea until you have proof of it. Nobody had incontrovertible evidence that coronavirus was going to be a disaster, so until someone does, you default to the null hypothesis that it won’t be.
Gallant wouldn’t have waited for proof. He would have checked prediction markets and asked top experts for probabilistic judgments. If he heard numbers like 10 or 20 percent, he would have done a cost-benefit analysis and found that putting some tough measures into place, like quarantine and social distancing, would be worthwhile if they had a 10 or 20 percent chance of averting catastrophe.
Meanwhile, at the Onion, CDC Announces Plan To Send Every U.S. Household Pamphlet On Probabilistic Thinking
2 Risk and moral intuitions
The Copenhagen Interpretation of Ethics:
The Copenhagen Interpretation of Ethics says that when you observe or interact with a problem in any way, you can be blamed for it. At the very least, you are to blame for not doing more. Even if you don’t make the problem worse, even if you make it slightly better, the ethical burden of the problem falls on you as soon as you observe it. In particular, if you interact with a problem and benefit from it, you are a complete monster. I don’t subscribe to this school of thought, but it seems pretty popular.
We might consider that a probabilistic version of the information avoidance problem.
3 Difficulty of fat-tailed risks
🏗
Nassim Nicholas Taleb, On single point forecasts for fat tailed variables
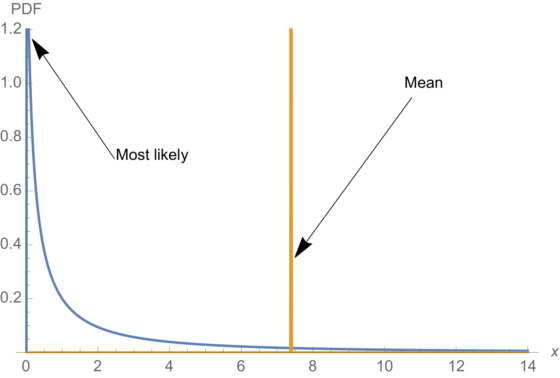
- Forecasting single variables in fat tailed domains is in violation of both common sense and probability theory.
- Pandemics are extremely fat tailed.
- Science is not about making single points predictions but understanding properties (which can sometimes be tested by single points).
- Risk management is concerned with tail properties and distribution of extrema, not averages or survival functions.
- Naive fortune cookie evidentiary methods fail to work under both risk management and fat tails as absence of evidence can play a large role in the properties.
Full of lots of sizzling invective! Not all well explained! For example, what is a fortune cookie evidentiary method? I do not know, but Taleb seems to feel it is explained by this fun bit of advice-cum-self-promotion:
We do not need more evidence under fat tailed distributions—it is there in the properties themselves (properties for which we have ample evidence) and these clearly represent risk that must be killed in the egg (when it is still cheap to do so). Secondly, unreliable data—or any source of uncertainty—should make us follow the most paranoid route. The entire idea of the author’s Incerto is that more uncertainty in a system makes precautionary decisions very easy to make (if I am uncertain about the skills of the pilot, I get off the plane).
3.1 Exponential growth
Technically exponential dynamics are not risk dynamics per se but I will file this here, because risk in exponential dynamics are I suspect, especially hard.
4 Alternative risk measures
For some reason or other, slicing up risks into nice units seem to make them easier to understand, or at least feel easier to understand.
4.1 Micromorts
A Micromort. is a 1 in a million chance of dying suddenly from misadventure. It has a natural interpretation:
We can also consider the 18,000 people who died from “external causes” in England and Wales in 2008. That’s those people out of the total population of 54 million who died from accidents, murders, suicides and so on (see the Office of National Statistics website for more information). This corresponds to an average of
\[ 18,000 / (54 \times 365) \approx 1 \]
micromort per day, so we can think of a micromort as the average “ration” of lethal risk that people spend each day, and which we do not unduly worry about.
Micromorts are also used to compare death risks in different countries, not just inside the UK.
These have been applied in a bunch of places; see microCOVID (which I am a fan of for understanding COVID-19 risk. Micromarriages is great:
A micromarriage is a one in a million chance that an action will lead to you getting married, relative to your default policy. Note that some actions, such as dying, have a negative number of micromarriages associated with them.
4.2 Microlives
A microlife is a measure of actuarial life risk, telling you how much of your statistical life expectancy (from all causes) that you are burning through.
Acute risks, such as riding a motorbike or going skydiving, may result in an accident - a natural unit for comparing such risks is the Micromort, which is a 1-in-a-million chance of sudden death, for some defined activity.
However many risks we take don’t kill you straight away: think of all the lifestyle frailties we get warned about, such as smoking, drinking, eating badly, not exercising and so on. The microlife aims to make all these chronic risks comparable by showing how much life we lose on average when we’re exposed to them:
a microlife is 30 minutes of your life expectancy
To see this concept in action, check out this (early) perspective on COVID-19:
So, roughly speaking, we might say that getting COVID-19 is like packing a year’s worth of risk into a week or two.
4.3 Effective age
If we connect these numbers to survival analysis we can calculate an “effective age” (Brenner, Gefeller, and Greenland 1993).
5 Heuristics and biases in risk perception
Trying to work out how people make decisions and whether it is
- probabilistic
- rational
- optimal
- manipulable
and what definitions of each of those words would be required to make this work.
Economists often seem to really want the relationship between people’s empirical behaviour in the face of risk and the decision-theoretically-optimal strategy to be simple, in the sense of having a mathematically simple relationship. The evolutionarily plausible kind of simplicity of the idea that it is our messy lumpy Pleistocene brains worry about great white sharks more than loan sharks because the former have more teeth and other such approximate not-too-awful heuristics.
Assigned reading 1: The Beast Upon Your Shoulder, The Price Upon Your Head.
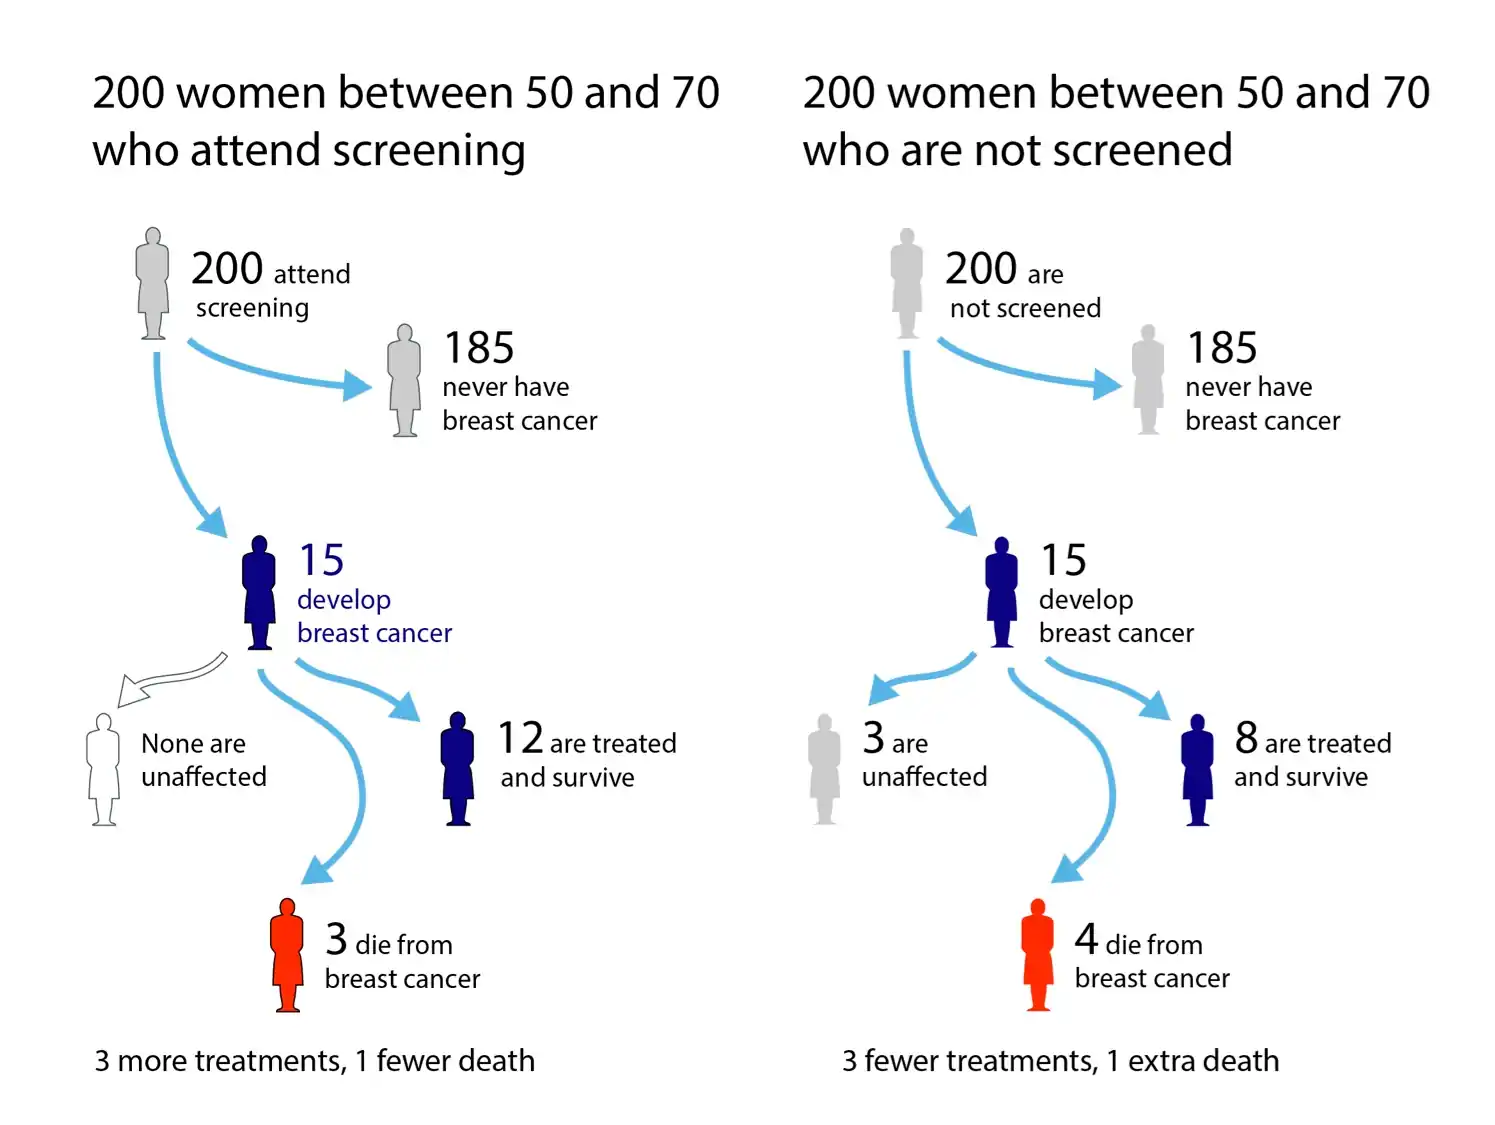
Assigned reading 2: Visualising risk in the NHS Breast cancer screening leaflet
Health information leaflets are designed for those with a reading age of 11, and similar levels of numeracy. But there is some reasonable evidence that people of low reading age and numeracy are less likely to take advantage of options for informed choice and shared decision making. So we are left with the conclusion —
Health information leaflets are designed for people who do not want to read the leaflets.
The classic Ellsberg paradox:
If you’re like most people, you don’t have a preference between B1 and W1, nor between B2 and W2. But most people prefer B1 to B2 and W1 to W2. That is, they prefer “the devil they know”: They’d rather choose the urn with the measurable risk than the one with unmeasurable risk.
This is surprising. The expected payoff from Urn 1 is $50. The fact that most people favour B1 to B2 implies that they believe that Urn 2 contains fewer black balls than Urn 1. But these people most often also favour W1 to W2, implying that they believe that Urn 2 also contains fewer white balls, a contradiction.
Ellsberg offered this as evidence of “ambiguity aversion,” a preference in general for known risks over unknown risks. Why people exhibit this preference isn’t clear. Perhaps they associate ambiguity with ignorance, incompetence, or deceit, or possibly they judge that Urn 1 would serve them better over a series of repeated draws.
The principle was popularised by RAND Corporation economist Daniel Ellsberg, of Pentagon Papers fame.
Rabin and Thaler (2001):
Using expected utility to explain anything more than economically negligible risk aversion over moderate stakes such as $10, $100, and even $1,000 requires a utility-of-wealth function that predicts absurdly severe risk aversion over very large stakes. Conventional expected utility theory is simply not a plausible explanation for many instances of risk aversion that economists study.
Ergodicity economics prefers not to regard this as a bias but as a learning strategy. How does that work then? I don’t know anything about it but it looks a little… cottage?
Mark Buchanan, How ergodicity reimagines economics for the benefit of us all:
The view of expected utility theory is that people should handle it by calculating the expected benefit to come from any possible choice, and choosing the largest. Mathematically, the expected ‘return’ from some choices can be calculated by summing up the possible outcomes, and weighting the benefits they give by the probability of their occurrence.
This inspired LML efforts to rewrite the foundations of economic theory, avoiding the lure of averaging over possible outcomes, and instead averaging over outcomes in time, with one thing happening after another, as in the real world.
There is an introduction by Jason Collins which puts it in layperson terms, which I also did not find that clear.
I am guessing some kind of online learning type setting, minimising regret over possibly non-stationary data or something? Or a cleanskin predictive coding? 🤷♂
6 Best practices in risk communication
7 Incoming
- Covid Panic is a Site of Inter-Elite Competition. Freddie goes a bit far on this one (“a particularly strange form of worry porn that progressives have become addicted to in the past half-decade. It’s this thing where they insist that they don’t want something to happen, but they describe it so lustily, imagine it so vividly, fixate on it so relentlessly, that it’s abundantly clear that a deep part of them wants it to happen.”) Steady on there Freddie, the article you are linking to is not great, but, uh, rein in the generalised mind reading. I do agree there is a lot of performative COVID-fearing about, but also, good luck getting clicks when describing modern events with clinical dispassion. Show us your sampling methodology and incentive awareness.
- Why Infinite Coin-Flipping is Bad - by Sarah Constantin


