Data dimensionality reduction
Wherein I teach myself, amongst other things, feature selection, how a sparse PCA works, and decide where to file multidimensional scaling
March 22, 2015 — September 10, 2020
Suspiciously similar content
🏗🏗🏗🏗🏗
I will restructure learning on manifolds and dimensionality reduction into a more useful distinction.
You have lots of predictors in your regression model! Too many predictors! You wish there were fewer predictors! Maybe then it would be faster, or at least more compact. Can you throw some out, or summarize them in some sense? Also with the notion of similarity as seen in kernel tricks. What you might do to learn an index. Inducing a differential metric. Matrix factorisations and random features, random projections, high-dimensional statistics. Ultimately, this is always (at least implicitly) learning a manifold. A good dimension reduction can produce a nearly sufficient statistic for indirect inference.
1 Bayes
Throwing out data in a classical Bayes context is a subtle matter, but it can be done. See Bayesian model selection.
2 Learning a summary statistic
See learning summary statistics. As seen in approximate Bayes. Note this is not at all the same thing as discarding predictors; rather it is about learning a useful statistic to make inferences over some more intractable ones.
3 Feature selection
Deciding whether to include or discard predictors. This one is old and has been included in regression models for a long time. Model selection is a classic one, and regularised sparse model selection is the surprisingly effective recent evolution. But it continues! FOCI is an application of an interesting new independence test (Azadkia and Chatterjee 2019) that is very much en vogue despite being in an area that we all thought was thoroughly mined out.
4 PCA and cousins
A classic. Has a nice probabilistic interpretation “for free” via the Karhunen-Loève theorem. Matrix factorisations are the family that contains such methods. 🏗
There are various extensions such as additive component analysis:
We propose Additive Component Analysis (ACA), a novel nonlinear extension of PCA. Inspired by multivariate nonparametric regression with additive models, ACA fits a smooth manifold to data by learning an explicit mapping from a low-dimensional latent space to the input space, which trivially enables applications like denoising.
More interesting to me is Exponential Family PCA, which is a generalization of PCA to non-Gaussian distributions (and I presume to non-additive relations). How does this even work? (Collins, Dasgupta, and Schapire 2001; Jun Li and Dacheng Tao 2013; Liu, Dobriban, and Singer 2017; Mohamed, Ghahramani, and Heller 2008).
5 Learning a distance metric
A related notion is to learn a simpler way of quantifying, in some sense, how similar two datapoints are. This usually involves learning an embedding in some low-dimensional ambient space as a by-product.
5.1 UMAP
Uniform Manifold approximation and projection for dimension reduction (McInnes, Healy, and Melville 2018). Apparently super hot right now. (HT James Nichols). Nikolay Oskolkov’s introduction is neat. John Baez discusses the category theoretic underpinning.
5.2 For indexing my database
See learnable indexes.
5.3 Locality Preserving projections
Try to preserve the nearness of points if they are connected on some (weight) graph.
\[\sum_{i,j}(y_i-y_j)^2 w_{i,j}\]
So we see an optimal projection vector.
(requirement for sparse similarity matrix?)
5.4 Diffusion maps
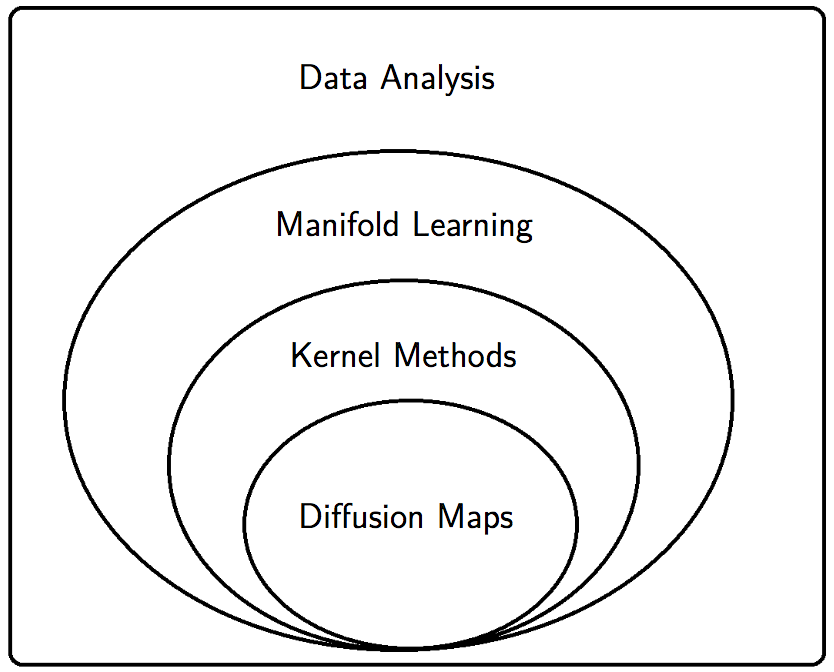
This manifold-learning technique seemed fashionable for a while. (Ronald R. Coifman and Lafon 2006; R. R. Coifman et al. 2005, 2005)
Mikhail Belkin connects this to the graph laplacian literature.
5.5 As manifold learning
Same thing, with some different emphases and history, over at manifold learning.
5.6 Multidimensional scaling
TDB.
5.7 Random projection
5.8 Stochastic neighbour embedding and other visualisation-oriented methods
These methods are designed to make high-dimensional data sets look comprehensible in low-dimensional representation.
Probabilistically preserving closeness. The height of this technique is the famous t-SNE, although as far as I understand it has been superseded by UMAP.
My colleague Ben Harwood advises:
Instead of reducing and visualising higher dimensional data with t-SNE or PCA, here are three relatively recent non-linear dimension reduction techniques that are designed for visualising high dimensional data in 2D or 3D:
- https://github.com/eamid/trimap
- https://github.com/lferry007/LargeVis
- https://github.com/lmcinnes/umap
Trimap and LargeVis are learned mappings that I would expect to be more representative of the original data than what t-SNE provides. UMAP assumes connectedness of the manifold so it’s probably less suitable for data that contains distinct clusters but otherwise still a great option.
6 Autoencoder and word2vec
The “nonlinear PCA” interpretation of word2vec, I just heard from Junbin Gao.
\[L(x, x') = \|x-x\|^2=\|x-\sigma(U*\sigma*W^Tx+b)) + b')\|^2\]
TBC.
7 For models rather than data
I don’t want to reduce the order of data but rather a model? See model order reduction.
