Regression with functional data
January 5, 2016 — January 23, 2025
Suspiciously similar content
Statistics where the samples are not just data but whole curves and manifolds, or subsamples from them. Function approximation meets statistics, especially in Karhunen-Loève expansion
1 Regression using curves
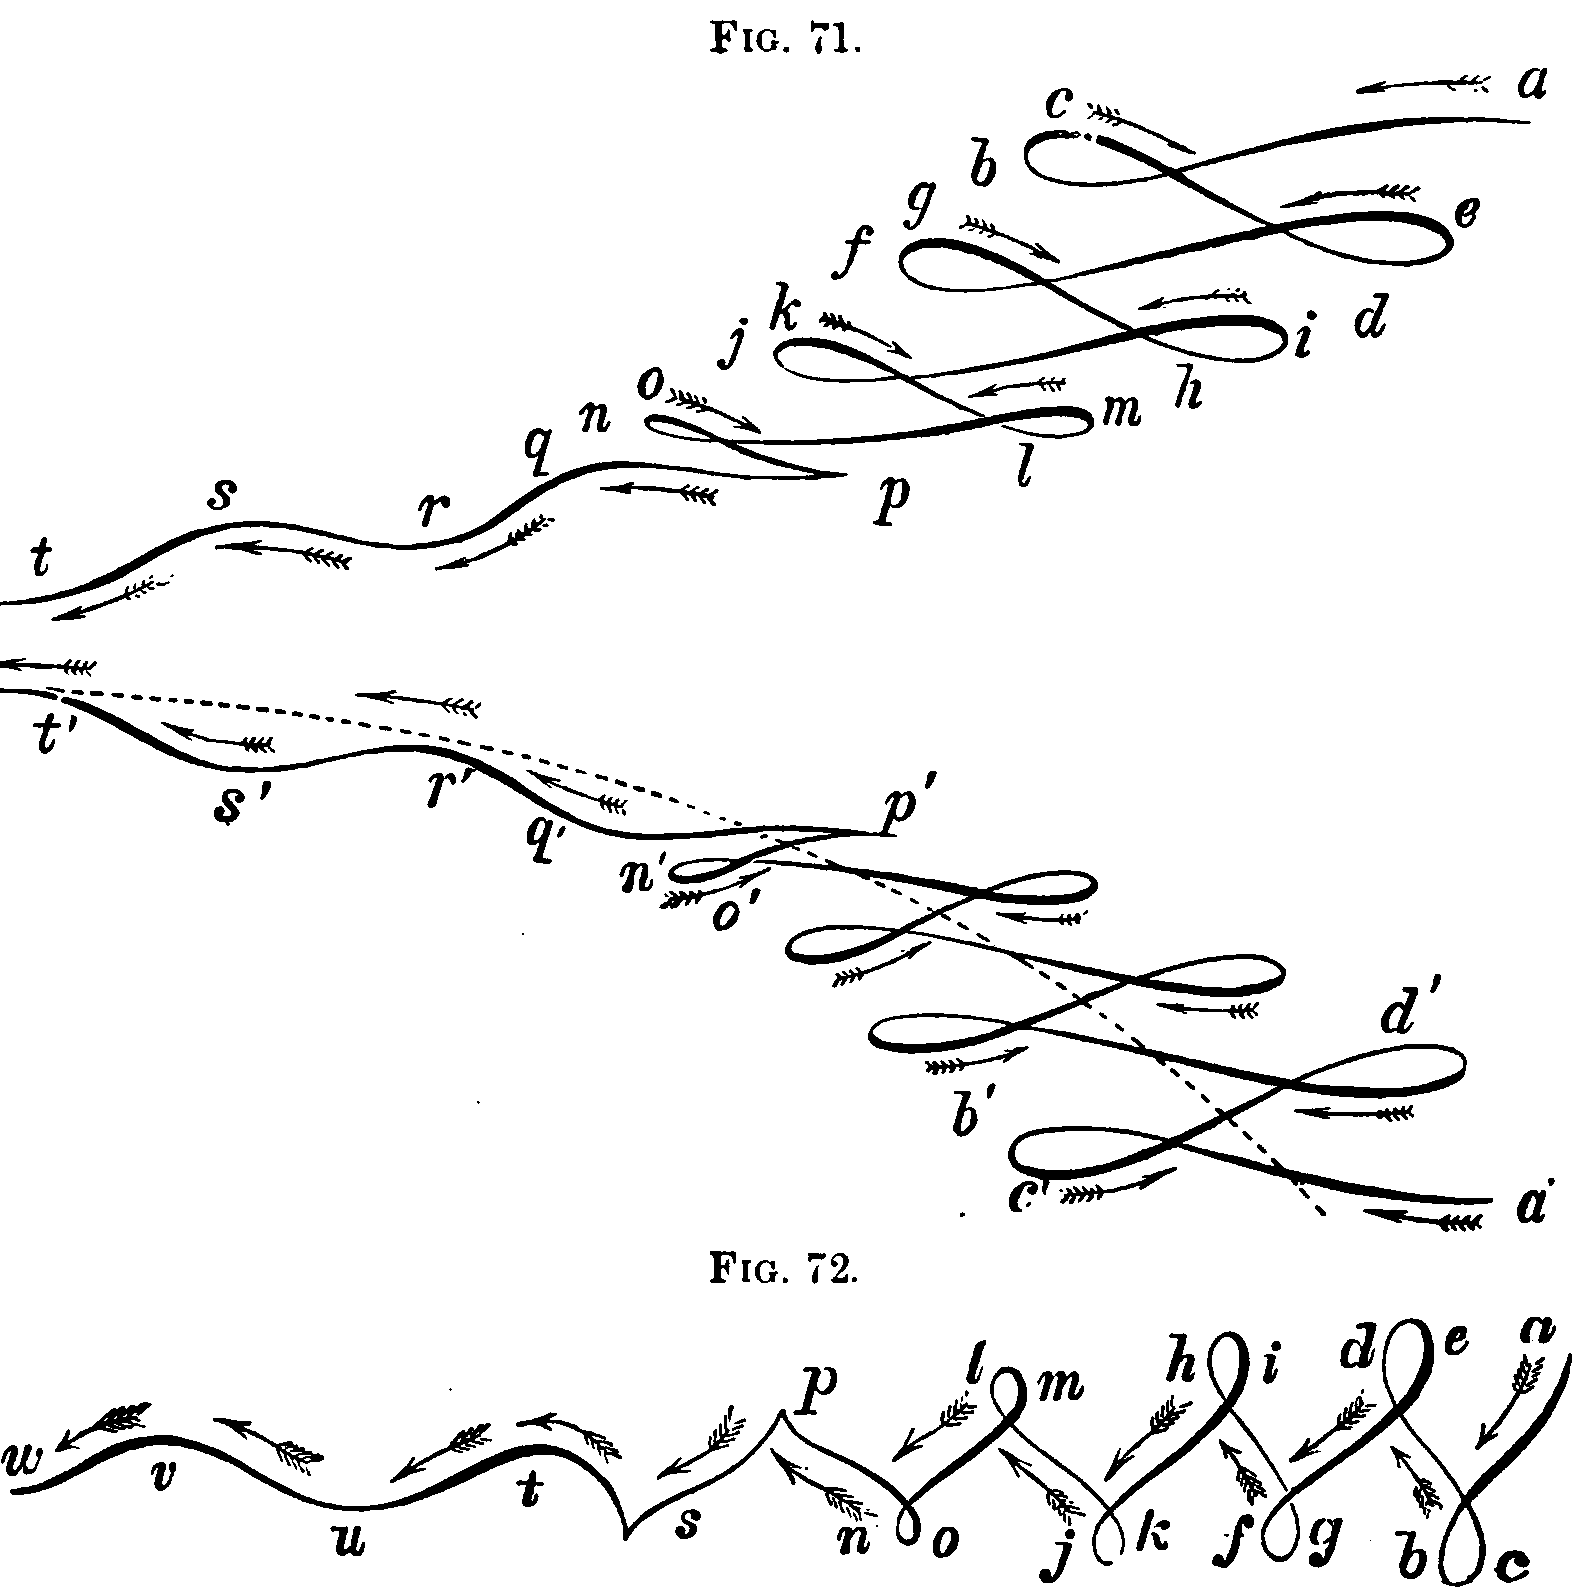
Functional data analysis, […] is about the analysis of information on curves or functions. For example, these twenty traces of the writing of “fda” are curves in two ways: first, as static traces on the page that you see after the writing is finished, and second, as two sets functions of time, one for the horizontal “X” coordinate, and the other for the vertical “Y” coordinate.
FDA is a collection of statistical techniques for answering questions like, “What are the main ways in which the curves vary from one writing to another?” In fact, most of the questions and problems associated with the usual multivariate data analysed by statistical packages like SAS and SPSS have their functional counterparts.
But what is unique about functional data is the possibility of also using information on the rates of change or derivatives of the curves. We use slopes, curvatures, and other characteristics made available because these curves are intrinsically smooth, and we can use this information in many useful ways. For example, our high school physics tells us that force = mass times acceleration, and that suggests that we look at the acceleration or second derivative of the pen’s position as a function of time. What we see in the plot of the magnitudes of the acceleration vector is that acceleration hits nearly ten meters/second/second. That’s a lot of energy! Equally remarkable is the stability of these acceleration records from one trial to the next. Also, note that where the acceleration magnitudes are near zero, both the X and Y accelerations must simultaneously be zero. The brain seems to know what it’s doing!
Regression on the shapes of entire curves is stylishly nonparametric. It can be simpler than you’d think, or at least simpler than I’d thing — just typical statistics on a functional basis, Hilbert-space-style. You can try to infer the differential operator that defines continuous dynamics. Apropos that, see the kernel trick. Many other nonparametric methods of function approximation, such as spline bases and density estimation, mixture models, and so on, are generalised by functional data analysis representation.
See (Wahba 1990) for the foundational spline-smoothing work, and check the big names textbooks (Ramsay and Silverman 2005; Ferraty and Vieu 2006b) for the modern framing.
An interesting related question is how you align the curves that are your objects of study. That’s a problem of warping.
2 Functional autoregression
I’m interested in functional autoregressive models. In these, we are concerned with a curve evolving in time. AFAICT this idea originates from (Bosq 1998) but has been generalised since then.
3 Variable selection in functional data
Apparently that’s a thing? (Matabuena 2025; Tucker, Wu, and Müller 2023)